Perspective beyond the headlines
Context, experience, and guidance for people who want to understand before they act.
The K-Shaped Economy and What It Means for Today’s Housing Market
.png)

The K-Shaped Economy: What It Is and Why It Matters
You've probably heard the phrase "the rich get richer." The K-shaped economy is basically that, but with a chart to prove it.
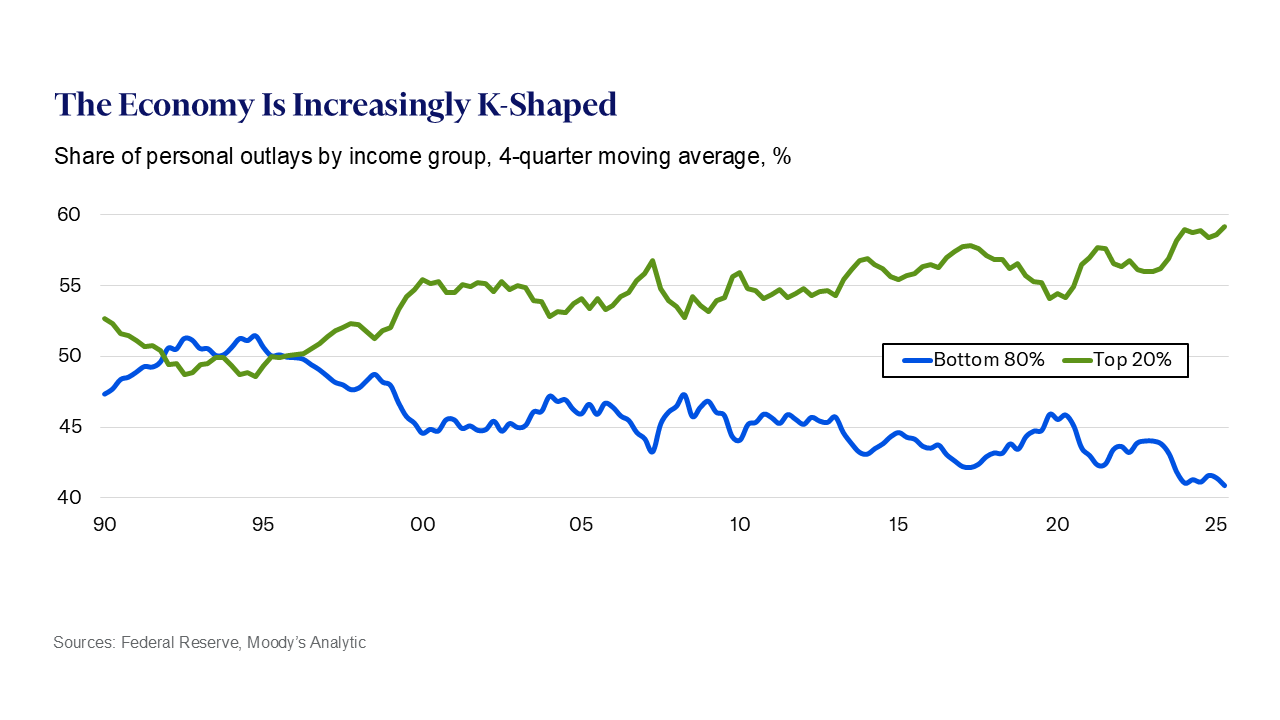
Imagine the letter K. The top half angles up, that's the top 20% of earners (households making over $175,000 a year), who now account for nearly 60% of all consumer spending. That's a new record going back to 1989. They're doing fine. Better than fine.
Now look at the bottom half of the K, angling down. That's everyone else. Personal savings have dropped by $469 billion since April, a 37% decline. The personal savings rate has fallen to 3.5%, the lowest since 2008. And loan delinquency rates across mortgages, auto loans, and credit cards have climbed to 4.8%, the highest since 2017.
So what does this mean for housing? The upper end of the market stays competitive and cash-rich buyers keep bidding, keeping prices firm in higher price points. But for the average buyer, the cushion is gone. Less savings means smaller down payments, tighter qualifying, and more people getting priced out or falling behind on payments they already have.
It's not that the economy is bad for everyone. It's that it's great for some and getting worse for others and that gap is widening. That's the K.
LEARN WHY BUYING ASSETS LIKE A HOME CLOSES THIS GAP!
Join us Thursday at 10 AM for our live webinar where we break down what all of this means for your local market!
.png)
.png)
.png)

Clarity for Every Market Cycle
Thoughtful insight for decision makers.
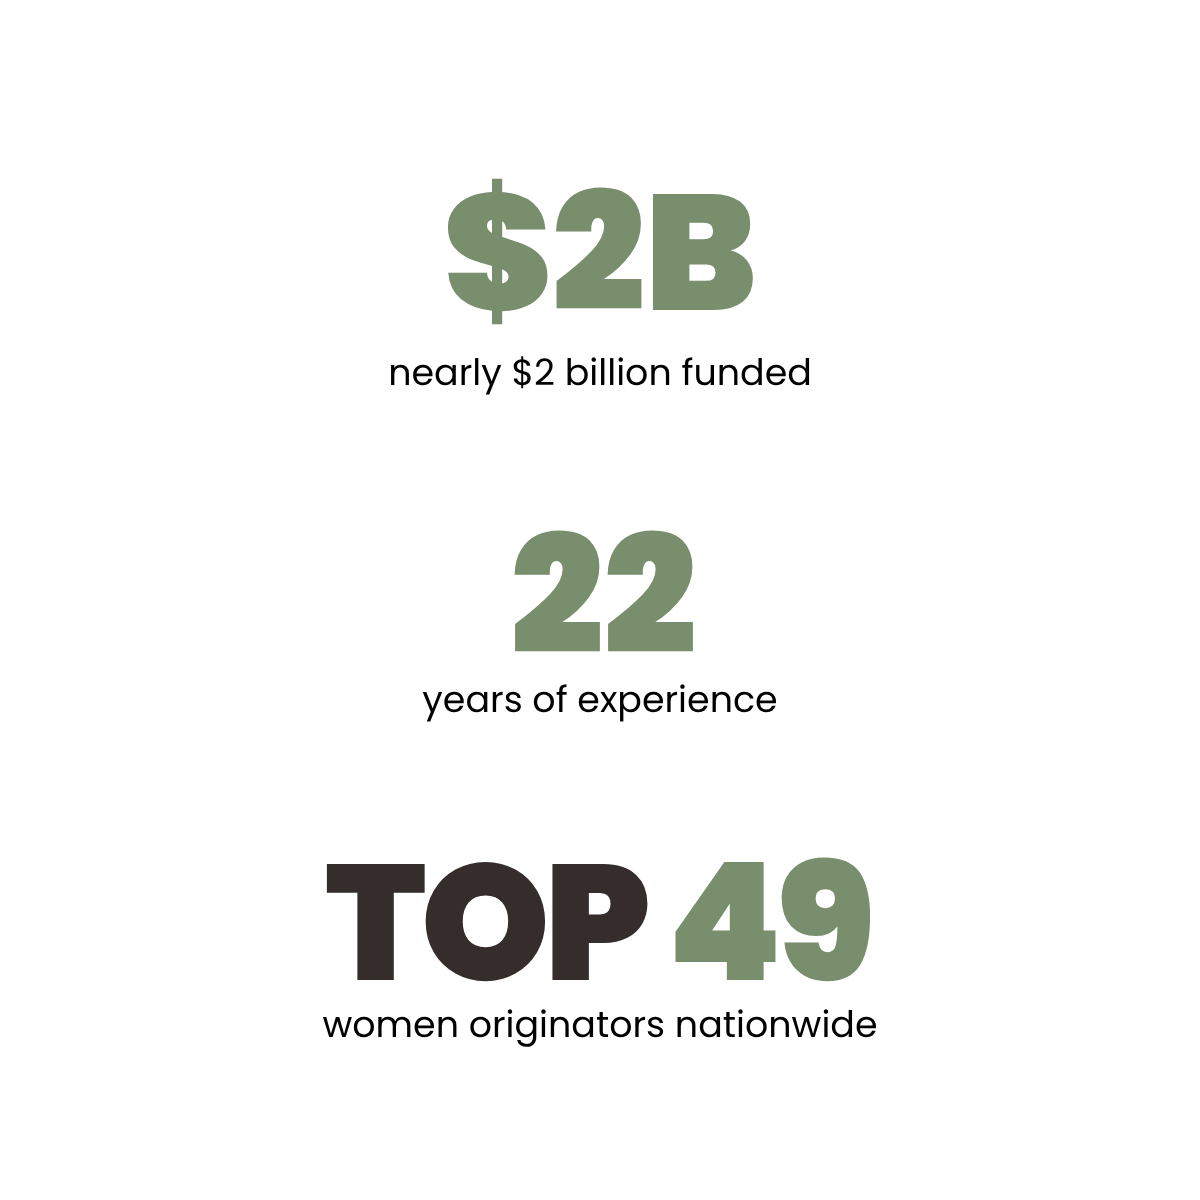
Mortgage insight shaped by over $2 billion in funded loans.